
On November 3, Texas voters ended more than three decades of Republican control over statewide elected offices. But beneath the victories, the defeats and the familiar election-night maps, another story was emerging.
Texas had cast nearly 1.8 million more votes for governor than it had four years earlier. Of those additional votes, nearly 93% of the net increase went to the Democratic candidate. And when The Directory News examined the results across all 254 Texas counties, we found something equally striking: every county had moved toward Democrats compared with the 2022 gubernatorial election.
Not every county voted Democratic; some remained Republican, but from the state's largest metropolitan areas to its smallest rural counties, the direction of the change was the same.
Together, those numbers reveal one of the most consequential changes in Texas voting patterns in recent history. They also raise questions about who participated in this election, how the electorate changed, and whether population growth and increased turnout can fully explain what happened.
The 92.9% Question
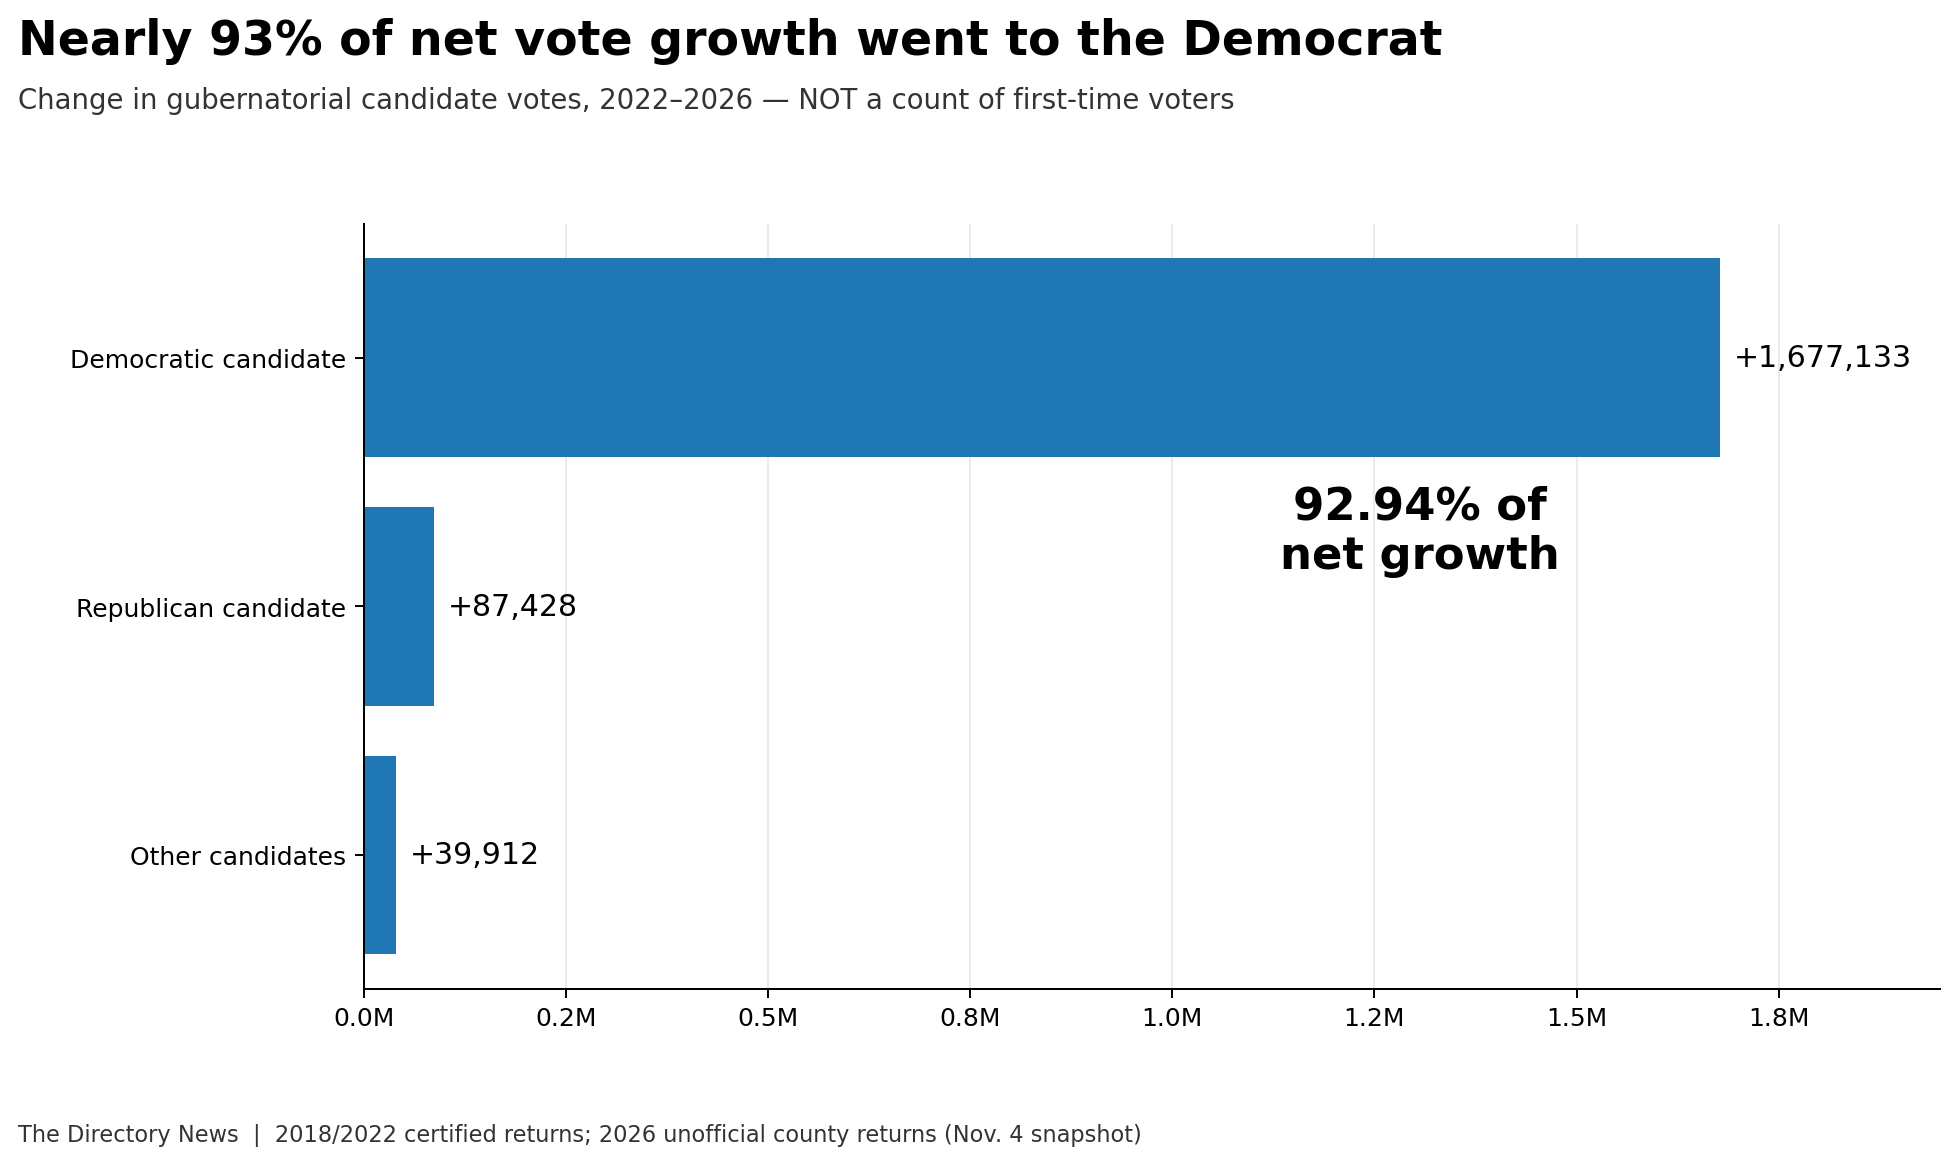
In 2022, Republican Gov. Greg Abbott defeated Democrat Beto O'Rourke with 4,437,099 votes to O'Rourke's 3,553,656.
Four years later, Abbott received 4,524,527 votes in his reelection bid against Democrat Gina Hinojosa, according to the Texas Secretary of State's November 4 unofficial results.
His vote total had increased by just 87,428.
Hinojosa, meanwhile, received 5,230,789 votes—an increase of 1,677,133 over the Democratic candidate's total four years earlier.
Overall, the number of votes cast for governor increased from 8,102,908 to 9,907,381.
That produces a remarkable calculation.
Democrats accounted for 92.9% of the net increase in gubernatorial votes. Republicans accounted for approximately 4.8%, with minor-party and write-in candidates accounting for the remainder.
The figure deserves careful explanation.
It does not mean 92.9% of first-time voters supported Hinojosa, nor does it tell us how individual Texans voted in previous elections. The calculation compares the net increase in votes received by Democratic candidates with the net increase in all votes cast for governor.
Existing voters may have changed their preferences. Others may have stayed home, while people who skipped 2022 returned to participate in 2026. The same statewide totals could result from several combinations of these behaviors.
Nevertheless, the arithmetic establishes something important: virtually the entire net increase in gubernatorial votes accrued to one party.
Abbott's Remarkably Consistent Numbers
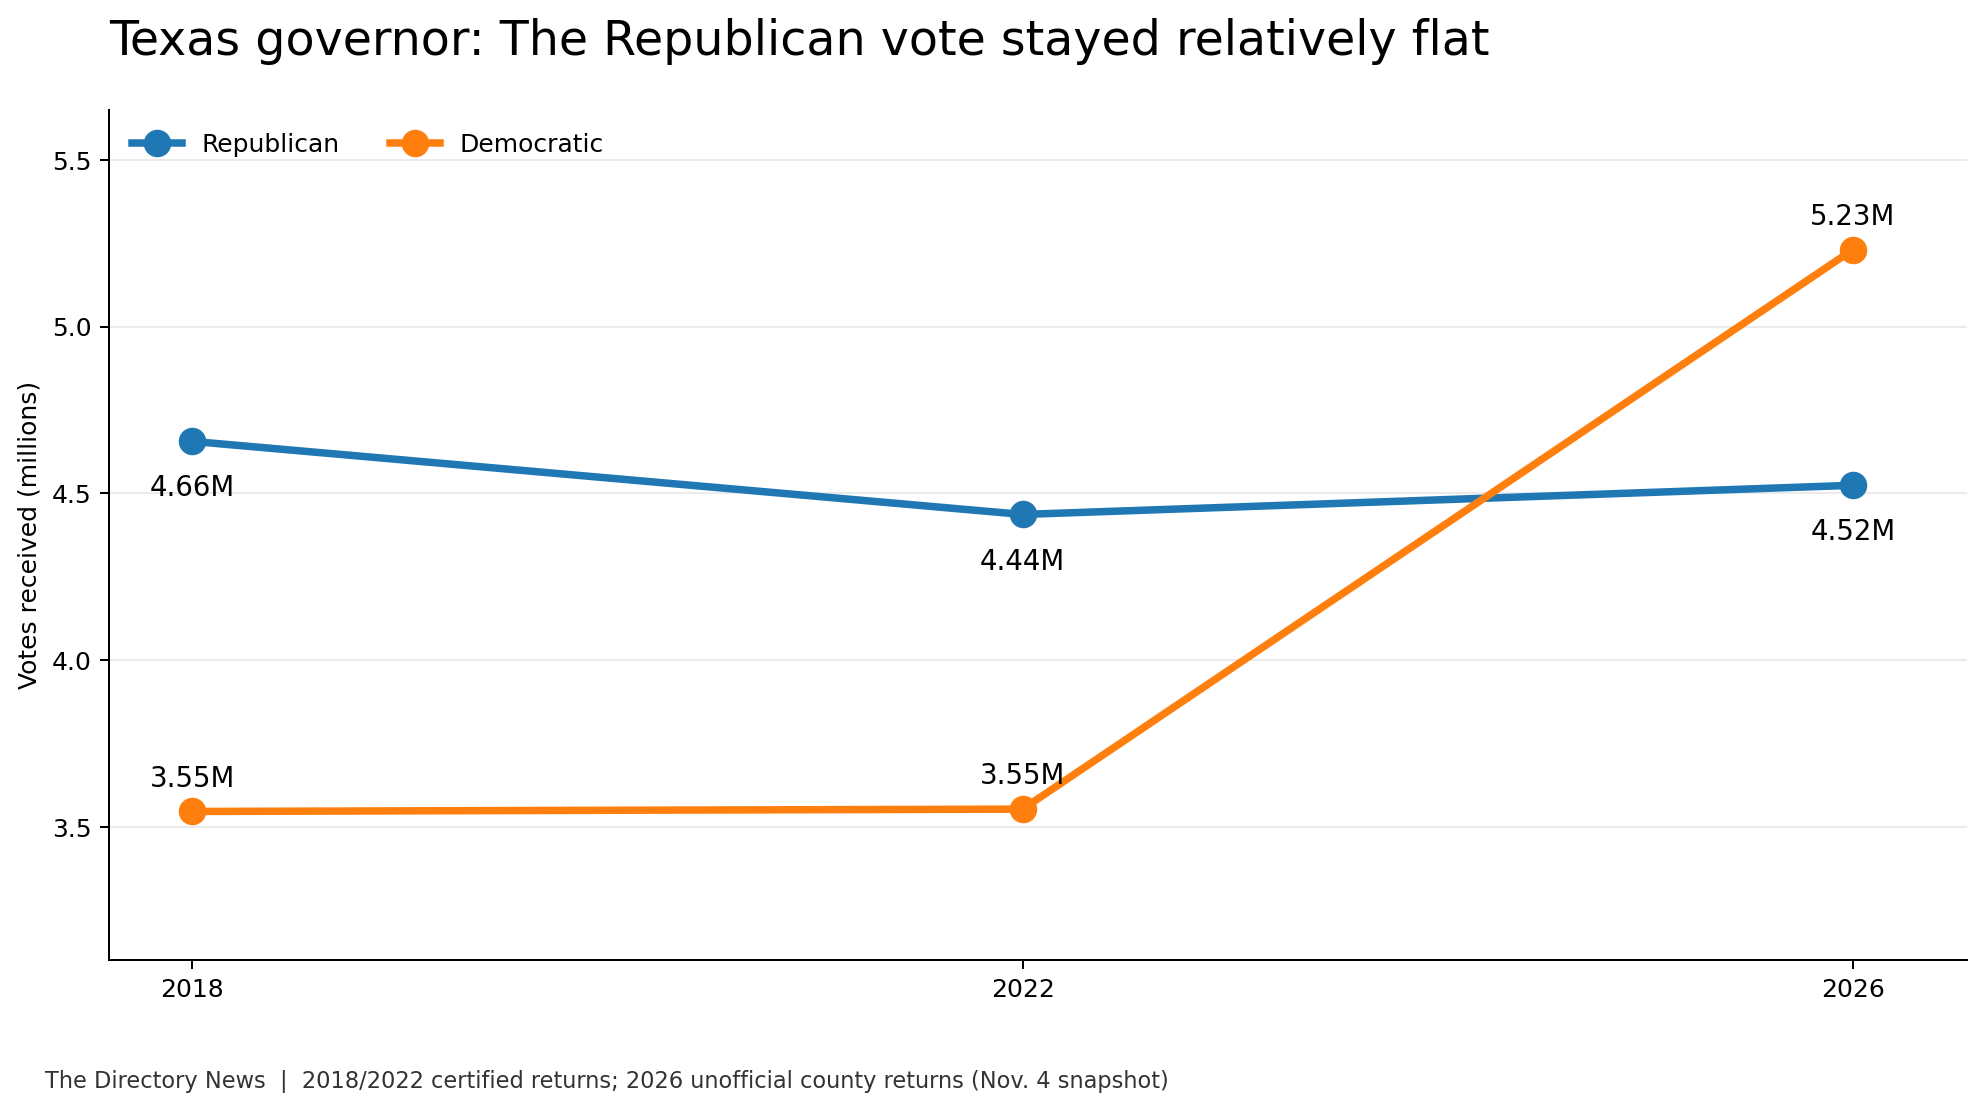
One of the most revealing aspects of the election is how little Abbott's raw vote total changed.
In 2018, Abbott received 4,656,196 votes against Democrat Lupe Valdez. Four years later, he received approximately 4.44 million against O'Rourke. In 2026, he received approximately 4.52 million against Hinojosa.
Across three elections spanning eight years, Abbott's support remained within a range of about 219,000 votes.
The Democratic totals tell a different story.
Valdez received approximately 3.55 million votes in 2018. O'Rourke received nearly the same number in 2022.
Then Hinojosa received 5.23 million.
The Democratic vote increased by more than 47% from the previous gubernatorial election, while Abbott's total increased by less than 2%.
In other words, the Republican incumbent did not experience a dramatic statewide collapse in his raw vote count. He received roughly as many votes as he had in previous elections, but faced an electorate in which far more ballots were cast for his Democratic opponent.
That distinction helps explain the scale of the defeat, though it does not establish that the same people were voting Republican in each election.
And the pattern looks particularly unusual against an earlier period of Texas electoral growth.
Between 2014 and 2018, gubernatorial voting increased by approximately 3.63 million votes. Democrats accounted for about 47% of that net increase, with Republicans receiving a comparable share.
Between 2022 and 2026, a smaller increase of 1.8 million votes produced a dramatically different partisan distribution.
The difference warrants examination.
Every County Moved
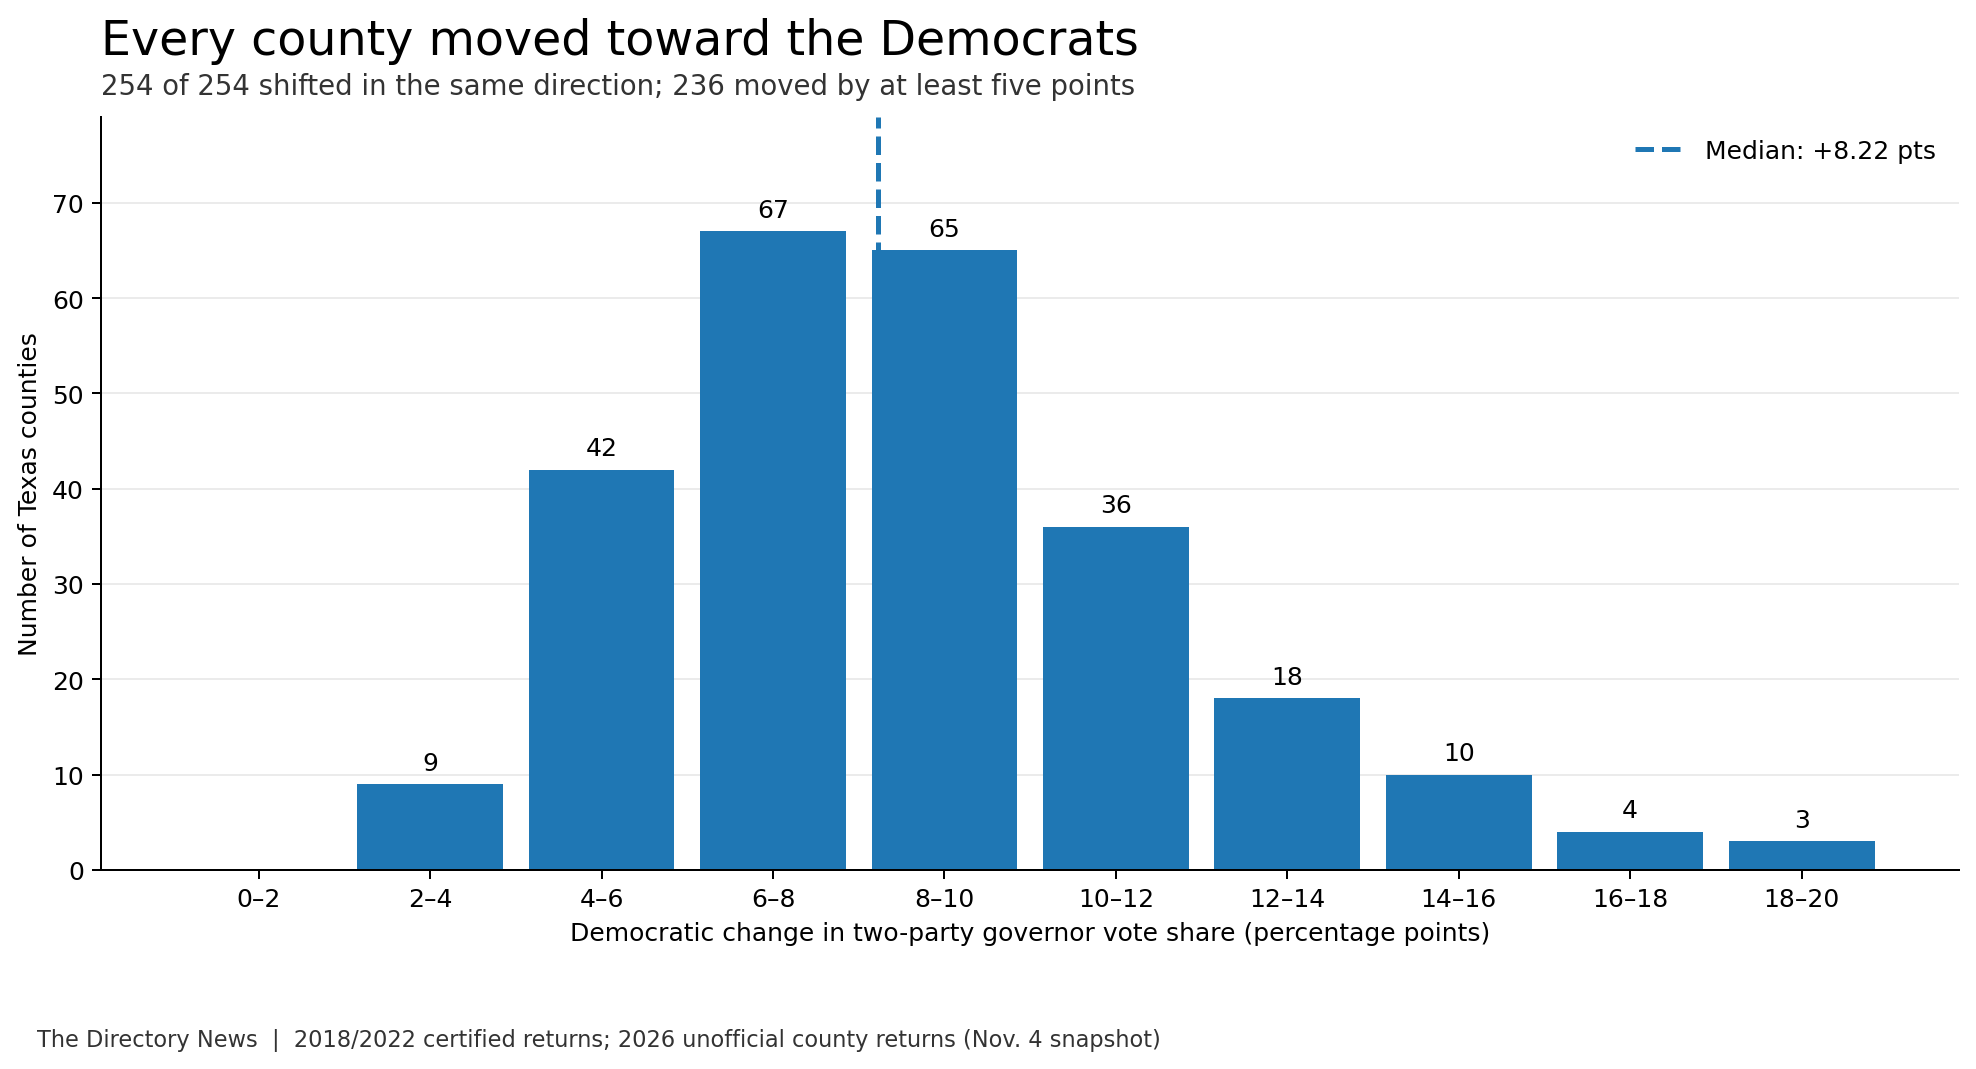
The Directory matched gubernatorial results from 2022 and 2026 across all 254 Texas counties, calculating changes in Republican votes, Democratic votes and two-party vote share.
The county totals reconcile exactly with the statewide election figures.
The results establish an unusually consistent movement toward Democrats.
Democratic two-party vote share increased in all 254 counties. In 236 counties, that increase was at least five percentage points. The median county shifted approximately 8.2 points toward Democrats.
Eighteen counties moved from Republican to Democratic majorities in the gubernatorial contest, including Collin, Denton, Tarrant, Williamson, Brazoria and Nueces.
The Democratic raw vote total increased in 253 counties. The lone exception was Terrell County, where the Democratic candidate received four fewer votes than in 2022.
Republican raw vote totals, meanwhile, declined in 179 counties and increased in 75.
There were even 48 counties where fewer votes were cast for governor overall, yet every one still recorded an increase in Democratic two-party vote share.
The significance is in the consistency of the movement.
A statewide election can produce substantial gains concentrated in major cities, fast-growing suburbs or regions experiencing demographic change. Those concentrations can overwhelm the political preferences of smaller counties.
Texas experienced that kind of concentration in 2026, but it also experienced a shift in the same direction across every county, including places where overall participation declined.
That does not mean every community experienced the same political transformation. The size of the Democratic shift varied considerably, from approximately 2.1 percentage points to more than 19 points.
It does, however, establish that the statewide result cannot be described solely as a handful of Democratic strongholds delivering more votes.
Where the Votes Came From
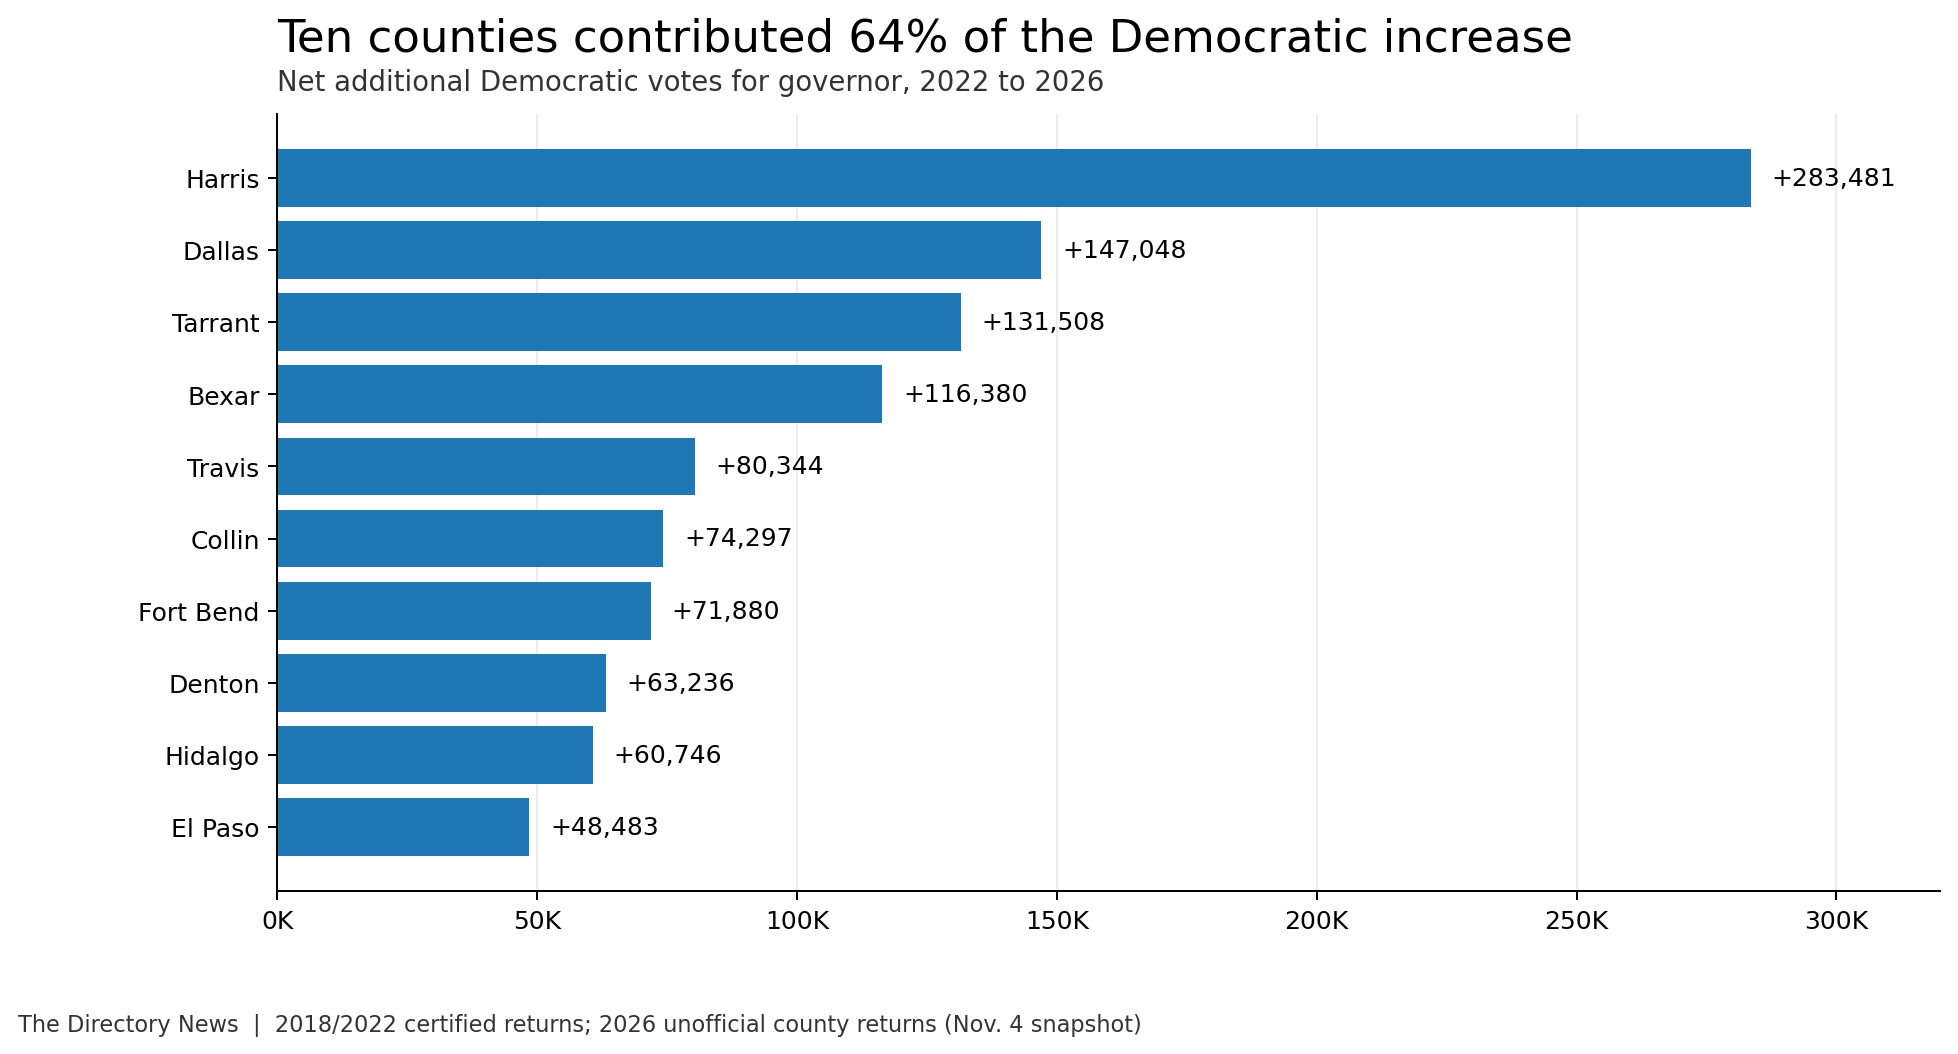
The largest increases in Democratic votes were concentrated in Texas' major metropolitan counties.
Harris County contributed an additional 283,481 Democratic votes compared with 2022, while Abbott received 6,411 fewer votes there.
Dallas County contributed another 147,048 Democratic votes. Tarrant County added 131,508, Bexar County 116,380 and Travis County 80,344.
Together, the ten counties with the largest increases accounted for 1,077,403 additional Democratic votes—approximately 64% of the statewide Democratic gain.
The remaining 244 counties contributed another 599,730 net Democratic votes.
Yet even among the largest counties, the patterns differed.
In Collin County, both major-party candidates gained votes. Abbott received 17,330 more votes than in 2022, while Hinojosa received 74,297 more than O'Rourke had.
In Harris County, Democratic growth accompanied a small Republican decline.
In Tarrant County, Republican votes increased slightly, but Democratic votes increased by more than 131,000.
These distinctions matter because the statewide result was produced by several different county-level patterns.
Some places delivered more votes to both parties, but far more to Democrats. Others saw Republican support decline while Democratic support increased.
The totals identify where support changed. They cannot establish whether the change came from new voters, returning voters, different choices among existing voters or some combination of the three.
More Votes Than New Registrations
Population and voter-registration growth offer another way to examine the election.
According to the Texas Secretary of State, the number of registered voters increased from 17,672,143 in November 2022 to 19,041,684 in November 2026.
That represents a net increase of approximately 1.37 million registered voters.
During the same period, the number of votes cast for governor increased by approximately 1.8 million.
The difference is significant.
If Texas' larger registered electorate had voted for governor at the same rate as the 2022 electorate, the state would have recorded approximately 8.73 million gubernatorial votes.
Instead, it recorded 9.91 million.
Using that simple accounting model, approximately 628,000 additional votes are associated with the growth in registration, while another 1.18 million are associated with an increase in the proportion of registered voters casting a vote for governor.
Those are accounting components, not separate groups of identifiable voters. Registration totals reflect people entering and leaving the rolls, and the number of gubernatorial votes is not identical to the total number of ballots cast.
But the calculation establishes that registration growth alone cannot explain the increase.
Our county-level analysis reinforces that finding.
Voter registration increased in 199 counties and declined in 55. Yet 31 counties recorded more gubernatorial votes despite having fewer registered voters than in 2022.
Tarrant County presents one of the clearest examples.
Its registered electorate decreased by 32,503, while its gubernatorial vote total increased by 138,062.
The ratio of gubernatorial votes to registered voters rose from approximately 46.9% in 2022 to 59.4% in 2026.
Some of the electorate's increased participation therefore came from people already represented within the registration rolls, or from changes in the composition of those rolls.
Determining exactly how many were first-time voters, returning voters or people who had moved into the county requires individual participation histories.
An Unusual Election, but Not an Unprecedented Political Phenomenon
There is good reason to examine how unusual the 2026 results were.
Between 2018 and 2022, a majority of Texas counties moved toward Republicans in the gubernatorial contest, even as the statewide Democratic share improved slightly.
The shift was even more pronounced in the 2024 presidential election. An Associated Press-based analysis published by Axios found that 233 Texas counties moved toward Republicans compared with 2020.
Two years later, the gubernatorial electorate moved in the opposite direction across all 254 counties.
Those comparisons involve different offices, candidates and electorates, but they illustrate how political conditions can affect large numbers of counties simultaneously.
County elections are not independent events. Texans across the state encounter the same candidates, national political debates, economic conditions and statewide political controversies.
A substantial statewide political wave can therefore produce highly correlated results across very different communities.
The 2026 outcome is distinctive in its size and consistency. Calling it a statistical anomaly, however, would require a more complete historical model establishing how often comparable shifts occur and how much variation should normally be expected.
There is another important historical consideration.
Texas experienced a major increase in total voting from 2022, but participation did not surpass every previous midterm benchmark. The ratio of gubernatorial votes to registered voters remained slightly below its 2018 level.
The 2026 result was therefore not simply the product of an unprecedented proportion of registered Texans showing up at the polls.
The composition of the participating electorate mattered.
The Question the Returns Cannot Answer
The available numbers establish what changed, where it changed and the magnitude of the change.
They do not identify the people responsible for it.
Public election returns provide totals for candidates and geographic areas. They cannot show whether an individual voter supported Abbott in 2022 and Hinojosa in 2026, or whether someone voting in 2026 had previously stayed home.
Texas maintains voter-participation records that can help answer part of that question. Once the 2026 histories are submitted and reconciled, those records can distinguish voters who participated in both elections from those who participated in only one.
They can also help identify people with no recorded participation in recent general elections and those who returned after skipping 2022.
Even those records will not reveal individual ballot choices. That requires carefully interpreted survey evidence and other research.
There are also several plausible explanations for the statewide Democratic increase: a favorable national political environment, changing participation among different groups of voters, dissatisfaction with incumbent leadership, candidate-specific considerations and evolving political preferences in the state's growing communities.
The election returns alone cannot determine how much each contributed.
That limitation should not obscure what the existing numbers already establish.
Texas produced approximately 1.8 million more gubernatorial votes than four years earlier. The Democratic candidate received nearly 1.68 million additional votes, while the Republican incumbent's total changed comparatively little.
The Democratic share increased in every county, even as registration growth and participation patterns varied substantially.
The result was a statewide shift that reached beyond the largest Democratic strongholds and into communities with very different electoral histories.
The next phase of analysis will require voter-participation records, historical demographic comparisons and a closer examination of the counties that changed most dramatically.
Until then, the distinction is clear.
We can measure the change. We cannot yet fully explain who produced it.
And after an election that altered the political direction of Texas, understanding that difference may be as important as understanding who won.